Displaying a Mass Spectrum
PyMassSpec-Plot can also be used to display individual mass spectra.
To start, load a datafile and create an IntensityMatrix as before.
In [1]:
from domdf_python_tools.paths import PathPlus

cwd = PathPlus(".").resolve()
data_directory = PathPlus(".").resolve().parent.parent / "datafiles"
# Change this if the data files are stored in a different location

output_directory = cwd / "output"

from pyms.GCMS.IO.JCAMP import JCAMP_reader
from pyms.IntensityMatrix import build_intensity_matrix_i

jcamp_file = data_directory / "gc01_0812_066.jdx"
data = JCAMP_reader(jcamp_file)
tic = data.tic
im = build_intensity_matrix_i(data)
-> Reading JCAMP file '/home/runner/work/PyMassSpec-Plot/PyMassSpec-Plot/datafiles/gc01_0812_066.jdx'
Extract the desired MassSpectrum from the IntensityMatrix.
In [2]:
ms = im.get_ms_at_index(1024)
Import matplotlib and the plot_mass_spec() function, create a
subplot, and plot the spectrum on the chart:
In [3]:
import matplotlib.pyplot as plt
from pyms.Display import plot_mass_spec
fig, ax = plt.subplots(1, 1, figsize=(8, 5))
# Plot the spectrum
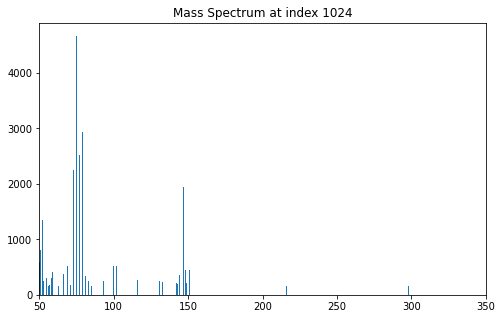
plot_mass_spec(ax, ms)
# Set the title
ax.set_title("Mass Spectrum at index 1024")
# Reduce the x-axis range to better visualise the data
ax.set_xlim(50, 350)
plt.show()
When not running in Jupyter Notebook, the spectrum may appear in a separate window like the one shown in Fig. 3.
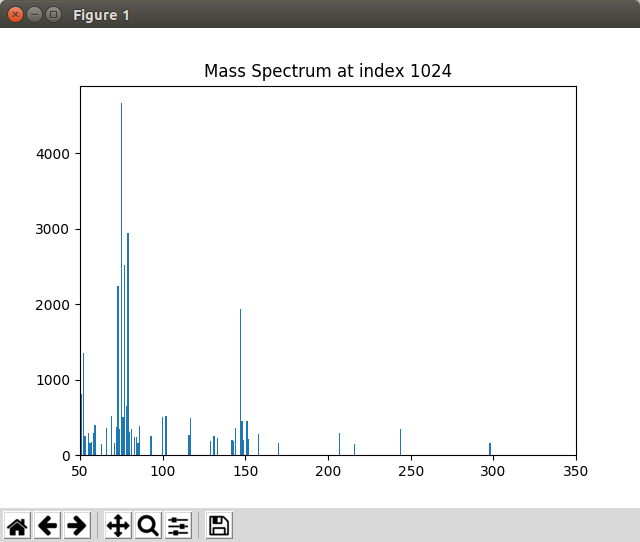
Fig. 3 Graphics window displayed by the Displaying_Mass_Spec.py script
Note
This example is in demo/jupyter/Displaying_Mass_Spec.ipynb and demo/scripts/Displaying_Mass_Spec.py.